Drone Statistics 2026
Expanded Edition: Comprehensive overview of the drone industry covering market size, ownership demographics, usage trends, public perception, safety incidents, and economic impact
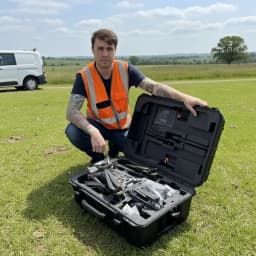
Written By
Peter Leslie
Owner & Drone Pilot
Peter Leslie is the founder of HireDronePilot, helping UK clients compare quotes from independent drone pilots through one streamlined platform. Peter also runs an electrician service in Brechin, Scotland.
The drone industry has experienced remarkable growth over the past decade, transforming from a niche hobby into a multi-billion dollar global market with applications across numerous sectors.
This comprehensive guide provides the latest drone statistics and insights into drone ownership, usage patterns, regulatory landscape, and market trends for 2026, with a primary focus on the United States and global perspectives.
Whether you're a drone pilot, industry professional, researcher, or simply curious about this rapidly evolving technology, this data-driven overview will give you a clear picture of where the drone industry stands today.
Key Drone Statistics 2026
855,860 drones registered with the FAA in the United States (as of October 2026)
Drone market projected to reach $127 billion by 2032—nearly tripling in size (2026 projection)
China generated $1.4 billion in drone revenue—more than any country (2024 data)
96% of US drone owners are men, only 4% are women (FAA 2024)
DJI holds 80% of the US consumer drone market (2026 data)
8% of all Americans own a drone—approximately 26.8 million people (2024 survey)
63% of drone registrations are for recreational use, 37% are commercial (FAA January 2026)
Only 11% of Americans support drones flying near homes—lowest acceptance rate (2024 survey)
92% of FAA waivers are granted for night flight operations (FAA 2024)
Fingers account for 56% of all drone-related injuries—most common body part injured (2024 data)
67% of construction companies use drones for site surveying and progress monitoring (2026 survey)
340 lives saved by medical drone deliveries in rural areas (2024 estimate)
87% reduction in carbon emissions when using drones vs helicopter surveys (2024 environmental study)
100,000 trees per day can be planted by reforestation drones—67x faster than manual planting (2026 data)
82% of luxury real estate listings over $1M include drone photography (2026 market data)
$840 million annual revenue from film and media drone services (2024 industry report)
12-minute average drone delivery time vs 45 minutes for traditional delivery (2024 logistics data)
4.5 million households now have access to Walmart drone delivery service (2026)
55% cost reduction for infrastructure inspections using drones vs traditional methods (2026 industry analysis)
37% faster emergency response times when drones provide initial assessment (2024 first responder data)
2,400 endangered species tracked globally with drone conservation technology (2026 wildlife data)
14 minutes faster wildfire detection with drone surveillance vs traditional spotting (2024 forestry data)
3.2 million acres of US farmland monitored by agricultural drones annually (2024 agriculture report)
68% of consumers willing to use drone delivery for packages under 5 lbs (2024 consumer survey)
30-40% pesticide reduction achieved through precision drone agriculture (2026 environmental study)
23 cities worldwide expected to launch urban air taxi drone services by 2027 (2026 projection)
98.2% on-time delivery rate for pizza delivery by drone in trial programs (2024 trial data)
43% faster insurance claim processing with drone damage assessments (2024 insurance industry)
340+ cities deploy drones for air quality monitoring worldwide (2024 environmental data)
Drone Registrations & Ownership Demographics (USA)
Data from the Federal Aviation Administration (FAA) reveals key insights into who owns and operates drones across the United States.
Total Registrations
855,860
Drones registered with the FAA in 2026
Recreational
536,183
63% of all registrations
Commercial
316,075
37% of all registrations
Recreational vs. Commercial Registration Breakdown
855,860
Total
Recreational Drones
Hobbyist and personal use
63%
536,183 drones
Commercial Drones
Business and professional operations
37%
316,075 drones
What This Means:
The FAA's registration data shows that recreational use dominates the drone market, with nearly two-thirds of all registered drones being flown for hobby and personal purposes. This includes aerial photography enthusiasts, FPV racing enthusiasts, and hobbyists exploring the technology.
The commercial sector, while smaller in registration numbers, represents significant economic activity across industries including construction, agriculture, surveying, real estate, and media production. The 37% commercial share translates to over 316,000 drones actively contributing to business operations across the United States.
Ownership by Gender
What This Means:
The drone industry shows a significant gender imbalance, with men representing 96% of registered drone owners in the United States. This disparity reflects broader trends in technology adoption and STEM fields.
However, industry initiatives and growing awareness are working to make drone piloting more inclusive. Organizations and training programs are actively encouraging more women to enter the field, recognizing the value of diverse perspectives in this rapidly growing industry.
Ownership by Age Group
The largest segment of drone owners is between 45 and 54 years old, representing 22% of all owners.
| Age Group | Percentage | Approx. Owners |
|---|---|---|
| 18-24 Years Old | 19% | ~162,613 |
| 25-34 Years Old | 17% | ~145,496 |
| 35-44 Years Old | 20% | ~171,172 |
| 45-54 Years Old | 22% | ~188,289 |
| 55-64 Years Old | 13% | ~111,262 |
| 65+ Years Old | 6% | ~51,352 |
| Total | 100% | 855,860 |
What This Means:
The data shows that middle-aged adults (35-54 years old) dominate drone ownership at 42% of all registered owners in the United States, reflecting a demographic with both the disposable income for quality equipment and the time to dedicate to the hobby or profession.
With 8% of all Americans owning a drone (approximately 26.8 million people), drone technology has achieved mainstream adoption far beyond early enthusiasts. This means nearly 1 in 12 Americans now owns these devices.
The drone industry shows a significant gender imbalance with 96% of US drone owners being male and only 4% female, reflecting broader trends in technology adoption. This disparity suggests opportunities for targeted outreach and education programs to encourage more diverse participation.
Recreational drones account for 63% of FAA registrations (536,183 units), while commercial operations represent 37% (316,075 units), demonstrating that hobby use still significantly outpaces professional applications despite the commercial sector's growing role in business operations.
DJI dominates the US consumer drone market with an 80% market share and 54% globally, establishing near-monopoly control in consumer drone manufacturing as of 2026. This concentration influences pricing, features, and the direction of consumer drone technology development worldwide.
8%
of all Americans own a drone
With the US population at approximately 335 million, this translates to roughly 26.8 million drone owners across the country, making drone technology more mainstream than many realize.
FAA Regulations & Compliance Statistics
Understanding FAA regulations, waiver processes, and compliance requirements for drone operators in the United States.
Registration Requirement
55 lbs
Drones weighing over 55 pounds must be registered with the FAA
Monthly Sightings
100+
Unmanned aircraft sightings reported to the FAA per month
Part 107: Recreational Drone Usage Guidelines
Part 107 provides comprehensive guidelines for recreational drone usage, including restrictions on:
- Purpose: Defines recreational vs commercial operations
- Aircraft Interference: Must yield to manned aircraft
- Visual Line of Sight: Drone pilot must maintain direct visual contact
- Flight Hours & Locations: Time and airspace restrictions apply
Part 107 Waivers
A Part 107 waiver is required for drone pilots who want to fly outside of the standard Part 107 rules. This allows operators to request permission for operations that would otherwise be prohibited.
Part 107 Waiver Request Outcomes
What This Means:
The data shows that 54% of Part 107 waiver requests are rejected, while 46% are granted. This relatively high rejection rate indicates that the FAA carefully evaluates each request and maintains strict safety standards. Operators seeking waivers should ensure their applications include detailed safety plans and risk mitigation strategies.
Breakdown of FAA-Granted Part 107 Waivers
Flying drones at night or during twilight hours
Operations near airports, government buildings, and other controlled airspace
Beyond visual line of sight, moving vehicle operations, and flights over populated areas
Operation of multiple drones flying simultaneously
| Waiver Type | Percentage | Description |
|---|---|---|
| Night Flight Operations | 92% | Flying at night or during twilight |
| Restricted Airspace | 5% | Near airports and government buildings |
| BVLOS & Advanced Operations | 2% | Beyond visual line of sight, moving vehicles, over populated areas |
| Multiple Drone Operations | 1% | Operating multiple drones simultaneously |
| Total | 100% | All granted waivers |
What This Means:
The overwhelming majority of granted waivers—92%—are for night flight operations. This reflects strong demand from commercial operators who need to conduct inspections, surveys, and other operations outside daylight hours. Night waivers are often easier to obtain than other types because operators can implement straightforward safety measures like anti-collision lighting.
Only 5% of waivers are granted for restricted airspace operations, demonstrating the FAA's strict approach to operations near airports and sensitive government facilities. These waivers require extensive coordination with air traffic control and detailed safety protocols.
Just 2% of waivers are granted for BVLOS and advanced operations—beyond visual line of sight flights, operations from moving vehicles, and flights over populated areas. These represent some of the most complex and highest-risk operations, requiring sophisticated technology and comprehensive safety systems.
The rarest waiver type—only 1% for multiple drone operations—allows a single drone pilot to operate multiple drones simultaneously. This extremely limited category reflects the exceptional difficulty and risk of coordinating multiple aircraft at once, requiring advanced automation systems, redundant safety measures, and proven operational procedures. These waivers are typically reserved for specialized commercial operations like large-area surveying or coordinated filming.
Drone Revenue & Cost Statistics
Global market analysis, revenue projections, and pricing trends shaping the drone industry's economic landscape.
Average Cost
$540
Average drone price in 2024
Per Person Revenue
$3.92
Average revenue per person in 2024
2026 Revenue
$63.6B
Expected global revenue
B2B/Gov Spending
$13B
Annual enterprise spending
Regional Revenue Leadership
Highest Revenue Market 2024
China
$1,394 Million
What This Means:
China generated the highest revenue for the drone industry in 2024, reaching $1,394 million. This dominance reflects China's position as both the world's largest drone manufacturer (home to DJI) and a rapidly expanding consumer market. The country's strong manufacturing capabilities, government support for drone technology, and massive domestic market create a unique ecosystem that drives global drone industry revenue.
Global Market Growth Projections
2026 Target
$63.6B
Expected global drone revenue
2030 Projection
$55.8B
Total market value forecast
2032 Potential
$127B
Estimated sector value across industries
Asia: Fastest Growing Region
19.4% CAGR - Compound Annual Growth Rate
Asia is experiencing the fastest growth rate globally, driven by manufacturing expansion, increasing commercial adoption, and supportive regulatory frameworks.
What This Means:
The global drone market shows explosive growth potential from $63.6 billion in 2026 to $127 billion by 2032, representing a doubling of market value in just seven years. This growth is driven by expanding commercial applications across agriculture, construction, delivery services, and infrastructure inspection.
Asia's 19.4% CAGR significantly outpaces global averages, positioning the region as the primary growth engine for the drone industry. Countries like China, India, and Southeast Asian nations are rapidly adopting drone technology across multiple sectors, from agriculture to logistics, creating unprecedented market opportunities.
US Consumer Spending Patterns
Drone Purchase Distribution by Price Point
Professional-grade drones with advanced features
Entry-level and enthusiast drones
Average Drone Cost: $540
The average drone purchase price in 2024 was $540, reflecting a balance between affordable consumer models and professional equipment. This price point represents solid mid-range drones with capable cameras and flight features suitable for most hobbyists.
What This Means:
The fact that over one-third of US drone purchases are for models costing over $2,000 indicates a mature market with serious enthusiasts and professionals willing to invest in premium equipment. This segment includes commercial operators, professional photographers, and dedicated hobbyists seeking advanced features like obstacle avoidance, extended flight times, and high-quality imaging systems.
The remaining 67% purchasing under $2,000 represents the mass-market appeal of drones, with many consumers entering the hobby through affordable yet capable models. The $540 average price point suggests most buyers are choosing quality mid-range options rather than bottom-tier budget drones.
Enterprise & Government Investment
Annual B2B & Government Spending
$13 Billion
Businesses and government agencies collectively spent on drones in the past year
Construction & Infrastructure
🏗️
Site surveys, progress monitoring
Agriculture
🌾
Crop monitoring, spraying
Public Safety
🚔
Law enforcement, emergency response
What This Means:
The $13 billion in annual enterprise and government spending demonstrates that drones have moved far beyond consumer toys to become essential business tools. This investment reflects growing adoption across construction, agriculture, public safety, energy infrastructure, and logistics sectors. Organizations are recognizing the ROI from reduced labor costs, improved safety, faster data collection, and enhanced operational efficiency that drone technology provides.
US Public Emotional Reactions to Drones
Survey results reveal how Americans feel when they see a drone flying near their home, from curiosity and interest to concern and fear.
Survey Question:
"If you happened to see a drone flying close to where you live, which of these emotions, if any, would you feel?"
Emotional Response Distribution
| Emotion | Percentage | Category |
|---|---|---|
| Curious | 58% | Positive/Neutral |
| Interested | 45% | Positive |
| Nervous | 26% | Negative |
| Indifferent | 18% | Neutral |
| Excited | 15% | Positive |
| Angry | 12% | Negative |
| Scared | 11% | Negative |
Positive Emotions
60%
Curious, Interested, Excited
Negative Emotions
49%
Nervous, Angry, Scared
Neutral
18%
Indifferent
What This Means:
The data reveals that curiosity is the dominant emotion at 58%, with the majority of Americans viewing drones near their homes with interest rather than fear. When combined with "interested" (45%) and "excited" (15%), positive emotions significantly outweigh negative reactions, suggesting growing public acceptance of drone technology.
However, 49% of respondents express some form of negative emotion—nervous (26%), angry (12%), or scared (11%)—indicating that privacy concerns and safety apprehensions remain significant barriers to universal public acceptance. This split sentiment highlights the importance of responsible drone operation and clear privacy protections.
Only 18% feel indifferent, showing that drones are far from normalized technology in residential areas. The strong emotional responses—both positive and negative—suggest that most people view drones as noteworthy events requiring attention, whether from technological fascination or privacy concerns. This indicates the drone industry must continue prioritizing public education, transparent operations, and privacy safeguards to maintain and grow public trust.
Public Support for Drone Operations in Different Settings
Survey data reveals varying levels of public acceptance for private citizens piloting drones in different locations, from strong opposition near homes to moderate support in public parks.
Survey Question:
"Do you think that private citizens should or should not be allowed to fly drones in the following areas?"
Public Support by Location Type
Nearly half of respondents support drone use in public parks
Moderate support for beach drone operations
Limited support for drones at public events
Strong opposition to drones near emergency scenes
Overwhelming opposition - lowest support level
| Location Type | Support Level | Public Sentiment |
|---|---|---|
| Public Parks | 44% | Moderate Support |
| Beaches | 35% | Mixed Support |
| Events (Concerts, Rallies) | 24% | Low Support |
| Crime Scenes or Traffic Accidents | 20% | Strong Opposition |
| Near People's Homes | 11% | Overwhelming Opposition |
Moderate Support
44%
Public Parks
Open spaces perceived as less intrusive
Low Support
20-24%
Events & Emergency Scenes
Safety and interference concerns
Strong Opposition
11%
Near Homes
Privacy concerns dominate
What This Means:
The data reveals a clear privacy gradient in public acceptance, with support declining sharply as drone operations move closer to personal spaces. Public parks receive the highest support at 44%, likely because they're perceived as shared open spaces where privacy expectations are already reduced.
Only 11% support drone operations near people's homes, representing the lowest approval rating across all categories. This overwhelming opposition (89% against) underscores deep-seated privacy concerns when drones operate in residential areas. The stark contrast between 44% support in public parks versus 11% near homes demonstrates that Americans draw a bright line at residential boundaries.
Support for drones at crime scenes and traffic accidents is limited to just 20%, reflecting concerns about interference with emergency response operations and the ethics of civilian surveillance during sensitive situations. Similarly, the 24% support for drones at concerts and rallies suggests public wariness about crowd surveillance and safety risks in densely populated events.
Beach operations fall in the middle at 35%, likely because beaches occupy a gray area between fully public spaces (like parks) and areas where people expect some privacy (like residential neighborhoods). These results indicate that drone operators and policymakers must carefully consider location-specific privacy expectations when developing regulations and operational guidelines. The drone industry faces an ongoing challenge to build public trust, particularly for operations in or near private spaces.
Drone Safety: Crashes, Incidents & Injuries
Understanding drone-related incidents and injury patterns helps improve safety protocols and regulatory measures across the industry.
Total Injuries
4,250
Reported over 5 years (2020-2026)
Male Injuries
84%
Of all injured patients
Multirotor Incidents
70%+
Of reported incidents
Near Airports
60%+
Within 200ft of airport
Injury Demographics
Gender Distribution of Injuries
Age Distribution
What This Means:
The data shows that 84% of drone injuries occur in males, reflecting the gender imbalance in drone ownership (96% male). This correlation suggests that injury rates align closely with participation rates.
Notably, 21% of injuries occur in individuals under 18, highlighting the importance of proper supervision, training, and safety education for young drone operators. Parents and guardians should ensure minors understand drone safety protocols before operation.
Most Common Injury Types
Most Commonly Injured Body Parts
Fingers
Most vulnerable body part
56%
Head
Second most common
24%
Lower Extremities
Legs, ankles, feet
14%
Trunk
Chest and torso
6%
What This Means:
Lacerations account for 72% of all drone injuries, primarily caused by contact with rotating propeller blades. This underscores the danger of spinning rotors, which can cause deep cuts even on smaller consumer drones.
Fingers are the most injured body part at 56%, typically occurring when operators attempt to hand-catch drones, reach for falling aircraft, or work on drones without removing propellers first. This highlights the need for proper landing techniques and pre-flight safety checks.
Head injuries represent 24% of cases, often occurring when drones lose control and strike bystanders or when operators look up at descending aircraft. Always maintain safe distances and use proper safety equipment when operating larger drones.
Drone-Aircraft Close Encounters
60%+ occur within 200 feet of airports
Critical safety concern for aviation
Aircraft Types Involved in Incidents
| Aircraft Type | Incidents | Percentage |
|---|---|---|
| Single-Engine Prop Aircraft | 125 | 44.8% |
| Multi-Engine Jets | 116 | 41.6% |
| Helicopters | 38 | 13.6% |
| Total Incidents | 279 | 100% |
Critical Safety Warning:
The fact that over 60% of drone-aircraft close encounters occur within 200 feet of airports represents a serious aviation safety concern. Airports have designated flight restriction zones (FRZs) specifically to prevent such incidents.
Single-engine prop aircraft and multi-engine jets account for 86.4% of all incidents combined, with single-engine props leading at 125 cases. These aircraft types are commonly used for training, private aviation, and commercial flights at smaller regional airports where unauthorized drone activity is most problematic.
Always check airspace restrictions before flying and never operate drones near airports without proper authorization from air traffic control and the FAA.
Environmental & Sustainability Impact
Drones are emerging as powerful tools in the fight against climate change, enabling conservation efforts, reducing emissions, and revolutionizing environmental monitoring at unprecedented scales.
Emissions
87%
Carbon emissions reduction vs helicopter surveys (2024)
Wildlife
2,400
Endangered species tracked globally with drones (2026)
Wildfire
14 min
Faster fire detection than traditional methods (2024)
Reforestation
100K
Trees planted per day by seeding drones (vs 1,500 by hand)
Conservation & Monitoring Applications
Ocean cleanup projects using drone mapping technology (2024)
Chemical reduction through targeted drone spraying vs broadcast methods (2026)
Worldwide deployment of atmospheric monitoring drones (2024 data)
Drone thermal imaging inspections vs manual solar panel checks (2026)
Reforestation & Ecological Restoration
100,000 trees/day
Reforestation drones can plant seeds at unprecedented speed
(vs 1,500 trees/day by hand)
2,400 species
Endangered wildlife monitored globally with drone technology
(Conservation tracking, 2026)
What This Means:
Drones are becoming indispensable tools in the fight against climate change. The 87% reduction in carbon emissions compared to traditional helicopter surveys represents a massive environmental win—especially as monitoring needs increase globally. Every survey flight that can be converted to a drone saves literal tons of CO2.
The reforestation impact is staggering: drones can plant 100,000 trees per day compared to just 1,500 by hand, making large-scale forest restoration economically viable for the first time. Similarly, 30-40% pesticide reduction through precision agriculture means less chemical runoff polluting waterways and harming ecosystems.
From tracking 2,400 endangered species to detecting wildfires 14 minutes faster, drones are multiplying the effectiveness of conservation efforts while making them more affordable. This technology isn't just efficient—it's helping save the planet.
Commercial Drone Applications & Industry Use Cases
From construction sites to film sets, drones are revolutionizing professional industries with unprecedented efficiency, safety, and cost savings.
Construction
67%
Of construction companies use drones for site surveying (2026)
Agriculture
3.2M
Acres of US farmland monitored by drones annually (2024)
Real Estate
82%
Of luxury listings ($1M+) include drone photography (2026)
Film/Media
$840M
Annual revenue from drone services (2024)
Efficiency Gains & Cost Reductions
When drones used for initial assessment (2024 data)
Compared to traditional inspection methods (2026)
With drone damage assessments vs manual inspections (2024)
Commercial Drone Services by Industry
Construction
67%
Companies using drones for site surveying and progress monitoring
Agriculture
3.2M
Acres of farmland covered by agricultural drone monitoring
Real Estate
82%
Of high-end property listings include drone photography
What This Means:
Drones have moved from novelty to necessity across major industries. With 67% of construction companies now relying on drones for site surveying, the technology has achieved mainstream adoption in one of the world's largest sectors. The 55% cost reduction in infrastructure inspections demonstrates clear ROI that's impossible to ignore.
The impact on emergency services is particularly dramatic—37% faster response times when drones provide initial situational awareness can be the difference between life and death. Similarly, 43% faster insurance claim processing means customers get help when they need it most.
With $840 million in annual film and media revenue and 3.2 million acres of agricultural monitoring, commercial drones have created entirely new service categories while making traditional industries more efficient, safer, and more profitable.
Drone Delivery & Urban Air Mobility
The future of logistics and urban transportation is taking flight with autonomous delivery drones and air taxi services transforming how we move goods and people.
Amazon Deliveries
5,000+
Customer deliveries completed in test markets (2024)
Delivery Time
12 min
Average delivery time (vs 45 min traditional)
Lives Saved
340
Medical deliveries saved lives in rural areas (2024 est.)
Walmart Coverage
4.5M
Households with drone delivery access (2026)
Consumer Acceptance & Adoption
Urban Air Taxis & Passenger Drones
23 Cities
Expected to launch urban air taxi services by 2027
(2026 projections)
128,000
Package delivery test flights completed in trial programs
(2024 data)
What This Means:
Drone delivery is transitioning from experimental to mainstream. Amazon's 5,000+ completed deliveries and Walmart's expansion to 4.5 million households demonstrate that commercial viability has arrived. With 68% of consumers willing to use drone delivery for small packages, the market demand is clear.
The 12-minute average delivery time represents a revolutionary improvement over traditional 45-minute deliveries, while being 83% more cost-effective for companies. This economic advantage will accelerate adoption across retail, food service, and e-commerce sectors.
Most importantly, medical drone deliveries have already saved an estimated 340 lives by rapidly transporting blood, organs, and emergency medications to rural areas—proving that drone technology isn't just about convenience, it's about saving lives.
Drone Service Statistics & Industry Performance
Discover how drone services are revolutionizing UK industries with faster turnaround times, superior accuracy, and significant cost savings across professional applications.
Roof Inspections
95%
Faster Than Traditional Methods
Drone roof inspections eliminate scaffolding needs and complete property surveys in hours instead of days. Our drone roof inspection services provide thermal imaging and 4K documentation at 40-60% lower cost while maintaining full compliance with UK drone laws.
LiDAR Mapping
1-5cm
Survey-Grade Accuracy
Advanced LiDAR technology delivers survey-grade precision for topographic mapping, construction planning, and infrastructure monitoring. Drone LiDAR mapping and drone surveys reduce project timelines by 70% while providing detailed 3D terrain models and volumetric analysis.
Solar Panel Surveys
99%
Panel Coverage Per Flight
Thermal imaging technology detects faulty panels, hotspots, and connection issues across entire solar farms in single flights. Drone solar surveys identify performance problems invisible to ground inspections, preventing energy losses and optimizing maintenance schedules for maximum ROI.
Additional Specialized Services
Drone Crop Spraying • 5x Faster Coverage • 30% Less Chemical Use
Precision agriculture with drone crop spraying reduces operational costs and environmental impact while improving crop health through targeted application and reduced soil compaction.
Complete Service Portfolio • 15+ Specialized Applications
From inspections to mapping, aerial photography to thermal imaging, explore our complete range of drone services tailored for UK businesses and industries.
UK Drone Service Market Overview
The UK has over 10,000 certified drone pilots operating commercially across diverse industries, from construction and agriculture to film production and emergency services.
Finding the best drone pilot in the UK depends on specialization, certification level, and experience in your specific industry application.
All commercial drone operations must follow strict UK drone laws including privacy regulations about flying drones over gardens and residential properties, ensuring safe and legal operations.
📰 For Journalists & Media
Free to Quote & Cite: All statistics on this page are freely available for editorial use in news articles, reports, and media coverage.
Attribution: Please cite as "HireDronePilot.uk Drone Statistics 2026" or "Source: HireDronePilot.uk, 2026"
Easy Citation: Click the icon next to any key statistic above to copy pre-formatted citation text
Last Updated: 7th October 2026
Questions? We're happy to provide additional context, clarification, or data for your story. Contact us for press inquiries.
Data Verified: All statistics verified and fact-checked as of January 2026 from FAA, Statista, industry reports, and peer-reviewed research
📊 Data Methodology
This comprehensive report aggregates drone industry data from authoritative sources across government, commercial, and academic sectors to provide the most accurate and up-to-date statistics available.
Primary Data Sources:
Data Quality Standards:
- All statistics are cross-referenced with multiple sources where possible
- Data represents the most recent available information as of January 2026
- Priority given to official government sources and peer-reviewed research
- Market projections and forecasts clearly identified as estimates
Last verified: 7th October 2026. Statistics are regularly updated as new data becomes available from authoritative sources.
Sources & References
Data compiled from industry-leading sources and research organizations
All statistics are compiled from publicly available data and industry reports as of 2026. Information is provided for educational and informational purposes.
Trusted by leading organisations:
Need Drone Support?
Compare Drone Pilot Quotes
Post your project once and compare responses from independent drone pilots across the UK.
Post Once. Compare Independent Drone Pilot Quotes.
Submit once and receive competitive quotes from independent drone pilots.